
 Read our new report
Fertility Trends
Fertility treatment 2019: trends and figures
UK statistics for IVF and DI treatment, storage, and donation
Published: May 2021
Fertility trends is our annual statistical release. The key findings are published on this page with a statistical appendix available for download.
Download the underlying dataset as .xlsx.
Table of contents
- Main points
- 30 years of the Human Fertilisation and Embryology Authority (HFEA)
- Section 1. IVF birth rates in 2019 were three times higher than in 1991
- Section 2. Great progress has been made in the reduction of multiple births, which now stands at 6%
- Section 3. Single embryo transfer is now common practice
- Section 4. Frozen embryo transfers have increased in use
- Section 5. The use of donor eggs and sperm has increased
- Section 6. Fertility treatment has enabled more people to have families later
- Section 7. Fertility treatment enables more patients with different partner types to have genetically linked families
- Section 8. There is considerable variation in NHS funding across the UK
- About our data
Main points
- Since the HFEA started recording information in 1991, there have been around 1.3 million in vitro fertilisation (IVF) cycles and over 260,000 donor insemination (DI) cycles, resulting in around 390,000 babies born.
- In 2019, almost 53,000 patients had 69,000 fresh and frozen IVF cycles and 5,700 DI cycles at HFEA licensed fertility clinics in the United Kingdom (UK).
- In 2019, birth rates for patients under 35 were 32% per embryo transferred, compared to below 5% for patients aged 43+ when using their own eggs.
- Patients aged 35-37 and 38-39 had a live birth rate per embryo transferred of 6% in 1991, this increased to 25% and 19% respectively in 2019.
- In 2019 the multiple birth rate reached 6%, falling from 28% in the 1990s.
- Single embryo transfer has become common practice and in 2019, one embryo was put back in 75% of IVF cycles, compared to just 13% in 1991.
- The growth in IVF cycles has stabilised since 2017, but frozen embryo transfers continue to increase year on year, increasing 86% from 2014-2019.
- Most IVF treatments involve the use of patient eggs and partner sperm (86% of IVF cycles in 2019), but the use of donor eggs and sperm has increased.
- The use of donor eggs considerably increases the chance of a live birth to over 30% for all age groups. Despite this, only 17% of patients aged 40+ used donor eggs in 2019.
- The proportion of IVF cycles undertaken by patients aged 40 and over has more than doubled from 10% (689 cycles) in 1991 to 21% (14,761 cycles) in 2019.
- There have also been changes in partner type, with DI cycles in 2019 more likely to involve a female partner than a male partner.
- The level of NHS funding for fertility treatment varies across the UK, with 62% of cycles funded by the NHS in Scotland in 2019, falling to 20% in some parts of England.
30 years of the Human Fertilisation and Embryology Authority (HFEA)
The HFEA was set up in 1991, following the passing of the Human Fertilisation and Embryology Act. We were the world’s first statutory regulatory body of assisted reproduction treatment and research involving human embryos. To celebrate 30 years of the HFEA, this report looks at how treatment numbers have changed over the past three decades, including changes in patient demographics and progress made in treatment outcomes. Since the establishment of the HFEA, the fertility sector has experienced massive growth and change. In 1991 there were around 6,700 IVF cycles recorded at licensed fertility clinics in the UK. By 2019, the number of cycles had increased tenfold to over 69,000.
Advances in technology have continued to improve outcomes and there is much to celebrate about the sector and the progress that has been made. Across the last three decades, almost 595,000 people have had around 1.3 million IVF cycles and 260,000 DI cycles. This has resulted in just over 390,000 babies born as a result of fertility treatment. Every single one of these cycles represents a huge emotional, and for many financial, investment for those involved. Every birth represents a life that may not have been possible without treatment.
1. IVF birth rates in 2019 were three times higher than in 1991
In 2019, almost 53,000 patients had around 69,000 fresh and frozen IVF cycles and around 5,700 DI cycles at licensed fertility clinics in the UK. After years of rapid growth, there has recently been a levelling off in the number of IVF cycles, which are similar to 2017 levels.
As figure 1 shows, birth rates from IVF have steadily increased over time with the average birth rate per embryo transferred standing at 24% in 2018, compared with just 7% in 1991. Provisional birth rate figures for 2019 suggest there may be a slowing in birth rates, but it is too early to determine a trend.
Patients under 35 have the highest birth rate per embryo transferred at 32% in 2019, but clinical improvements have led to an increased chance of a live birth for all patients under 43. Where patients aged 35-37 and 38-39 had a live birth rate per embryo transferred of 6% in 1991, this increased to 25% and 19% respectively in 2019.
Patients aged 43 and over have consistently had birth rates at or below 5% per embryo transferred when using their own eggs. However, in section 3 we discuss how donor eggs can increase the chance of success for these patients to above 30% on average.
Although live birth rates have increased steadily over the past three decades for most age groups, not all patients have the same chance of a live birth. Our recent report on Ethnic diversity in fertility treatment shows substantial variation in outcomes by ethnicity, with Black patients having lower birth rates on average than any other ethnic group. More details on this variation can also be found in the underlying data tables.
Figure 1. IVF birth rates have risen for patients under 43 in the last 30 years
Birth rates per embryo transferred using patient eggs by age band, 1991-2018, provisional 2019 data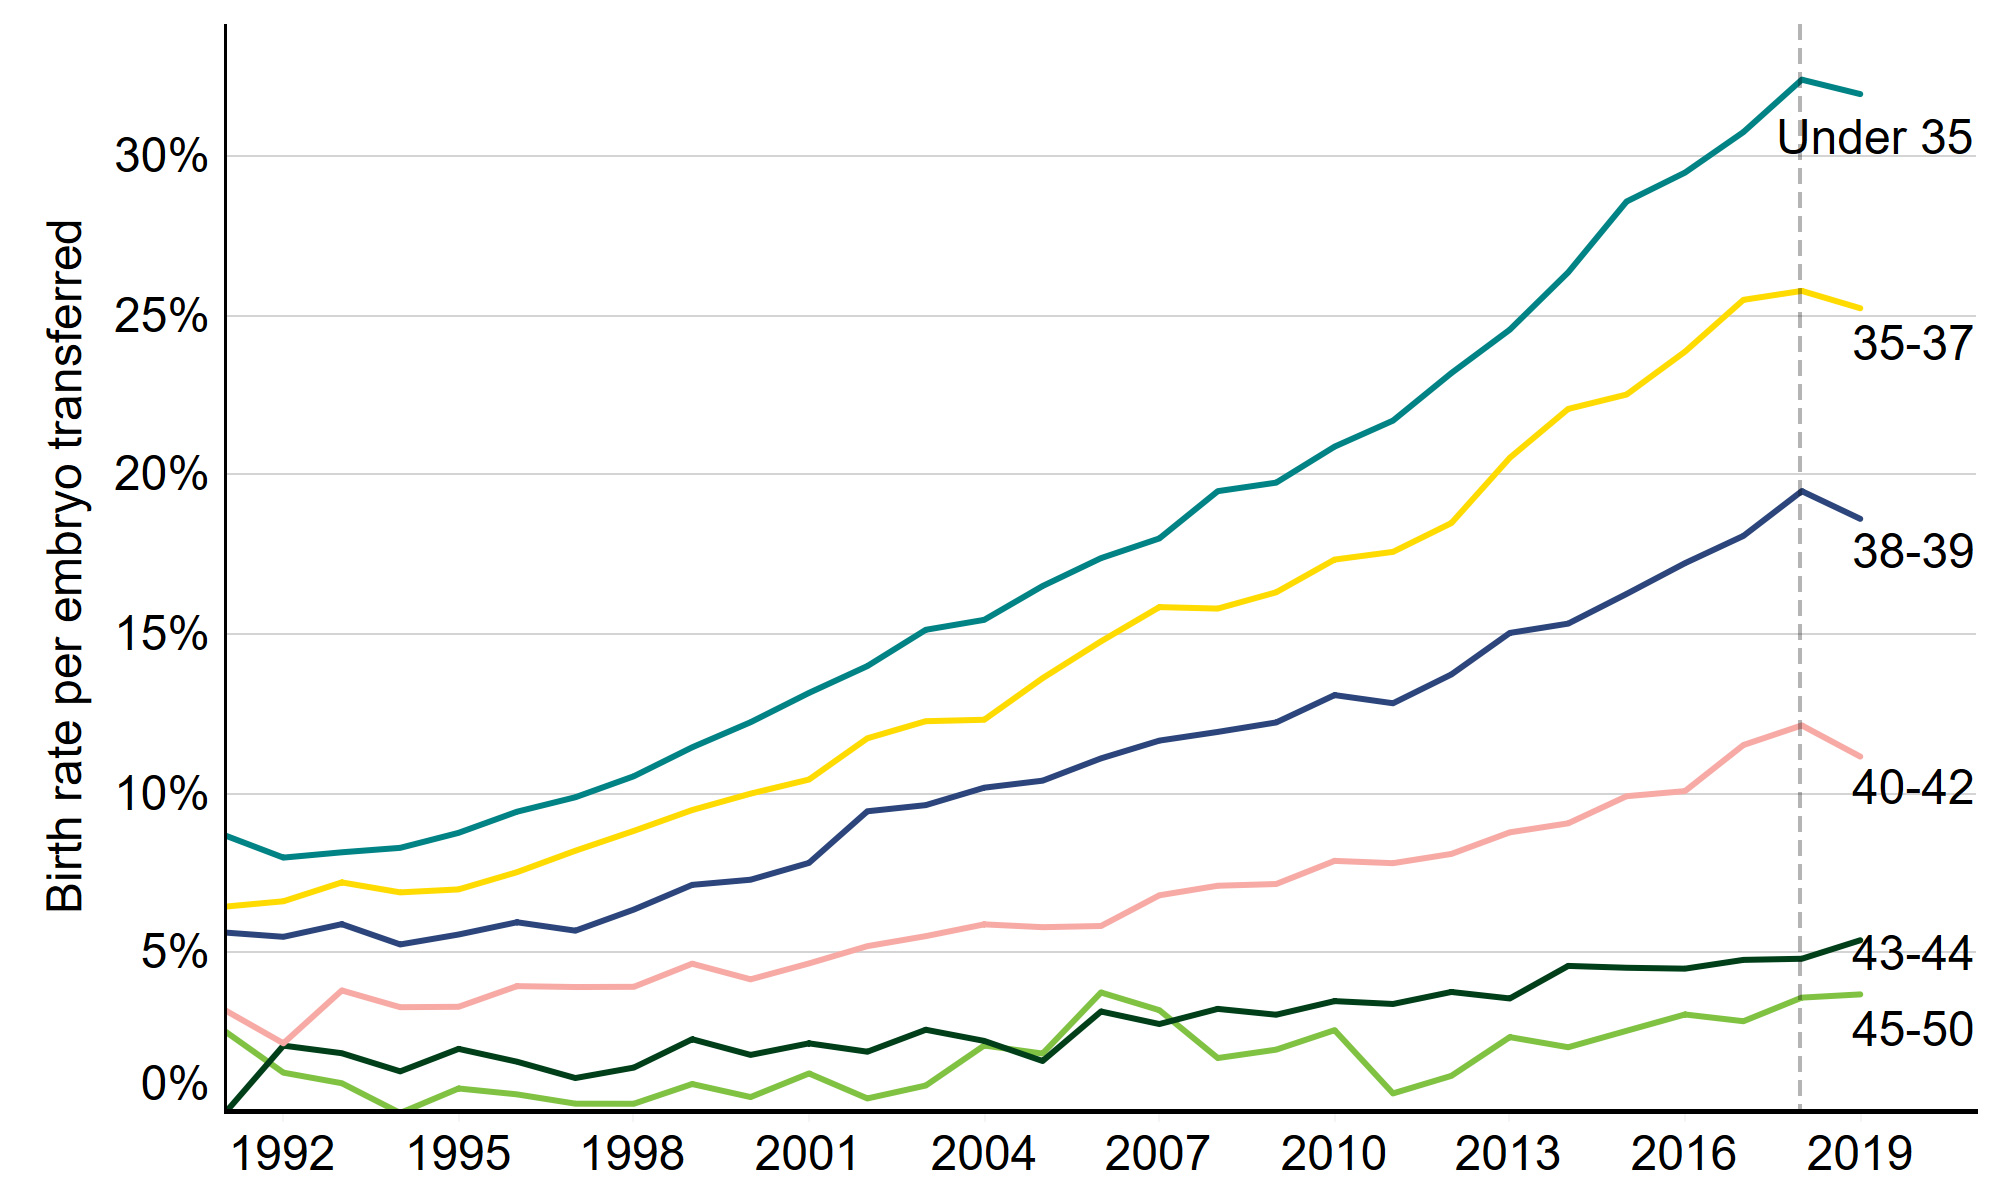
Download the underlying data for Figure 1. (xlxs 29kb)
Note figure 1: Birth rates for 2019 are provisional and yet to undergo validation. This data includes treatment cycles only, IVF, Patient egg. It excludes fresh and frozen PGT-M and PGT-A, surrogacy, and cycles where pregnancy was recorded but not outcome.
2. Great progress has been made in the reduction of multiple births, which now stands at 6%
In the 1990s the multiple birth rate was around 28% due to the practice of transferring back more than one embryo during treatment. Since then, great progress has been made in bringing this rate down, helped by the ‘One at a time’ campaign which we launched in 2007 to encourage the use of single embryo transfers. As part of this campaign, a multiple birth rate target of 10% was set which was achieved in 2017. Since then, the rate has fallen further, to just 6% in 2019. Multiple births remain a health risk for IVF patients and babies, but the decreasing multiple birth rate means that IVF is a safer treatment.
Our recent report on Ethnic diversity in fertility treatment highlighted that the multiple birth rate varied by ethnicity and Black patients experienced higher than average multiple births from 2014-18. While all clinics should have a multiple birth minimisation strategy in place, clinics should be mindful of the higher multiple birth rate in certain ethnic groups and seriously consider a review of their multiple birth policy where necessary.
Figure 2. Multiple birth rate from IVF reduced further to 6%
Average multiple birth rate, 1991-2019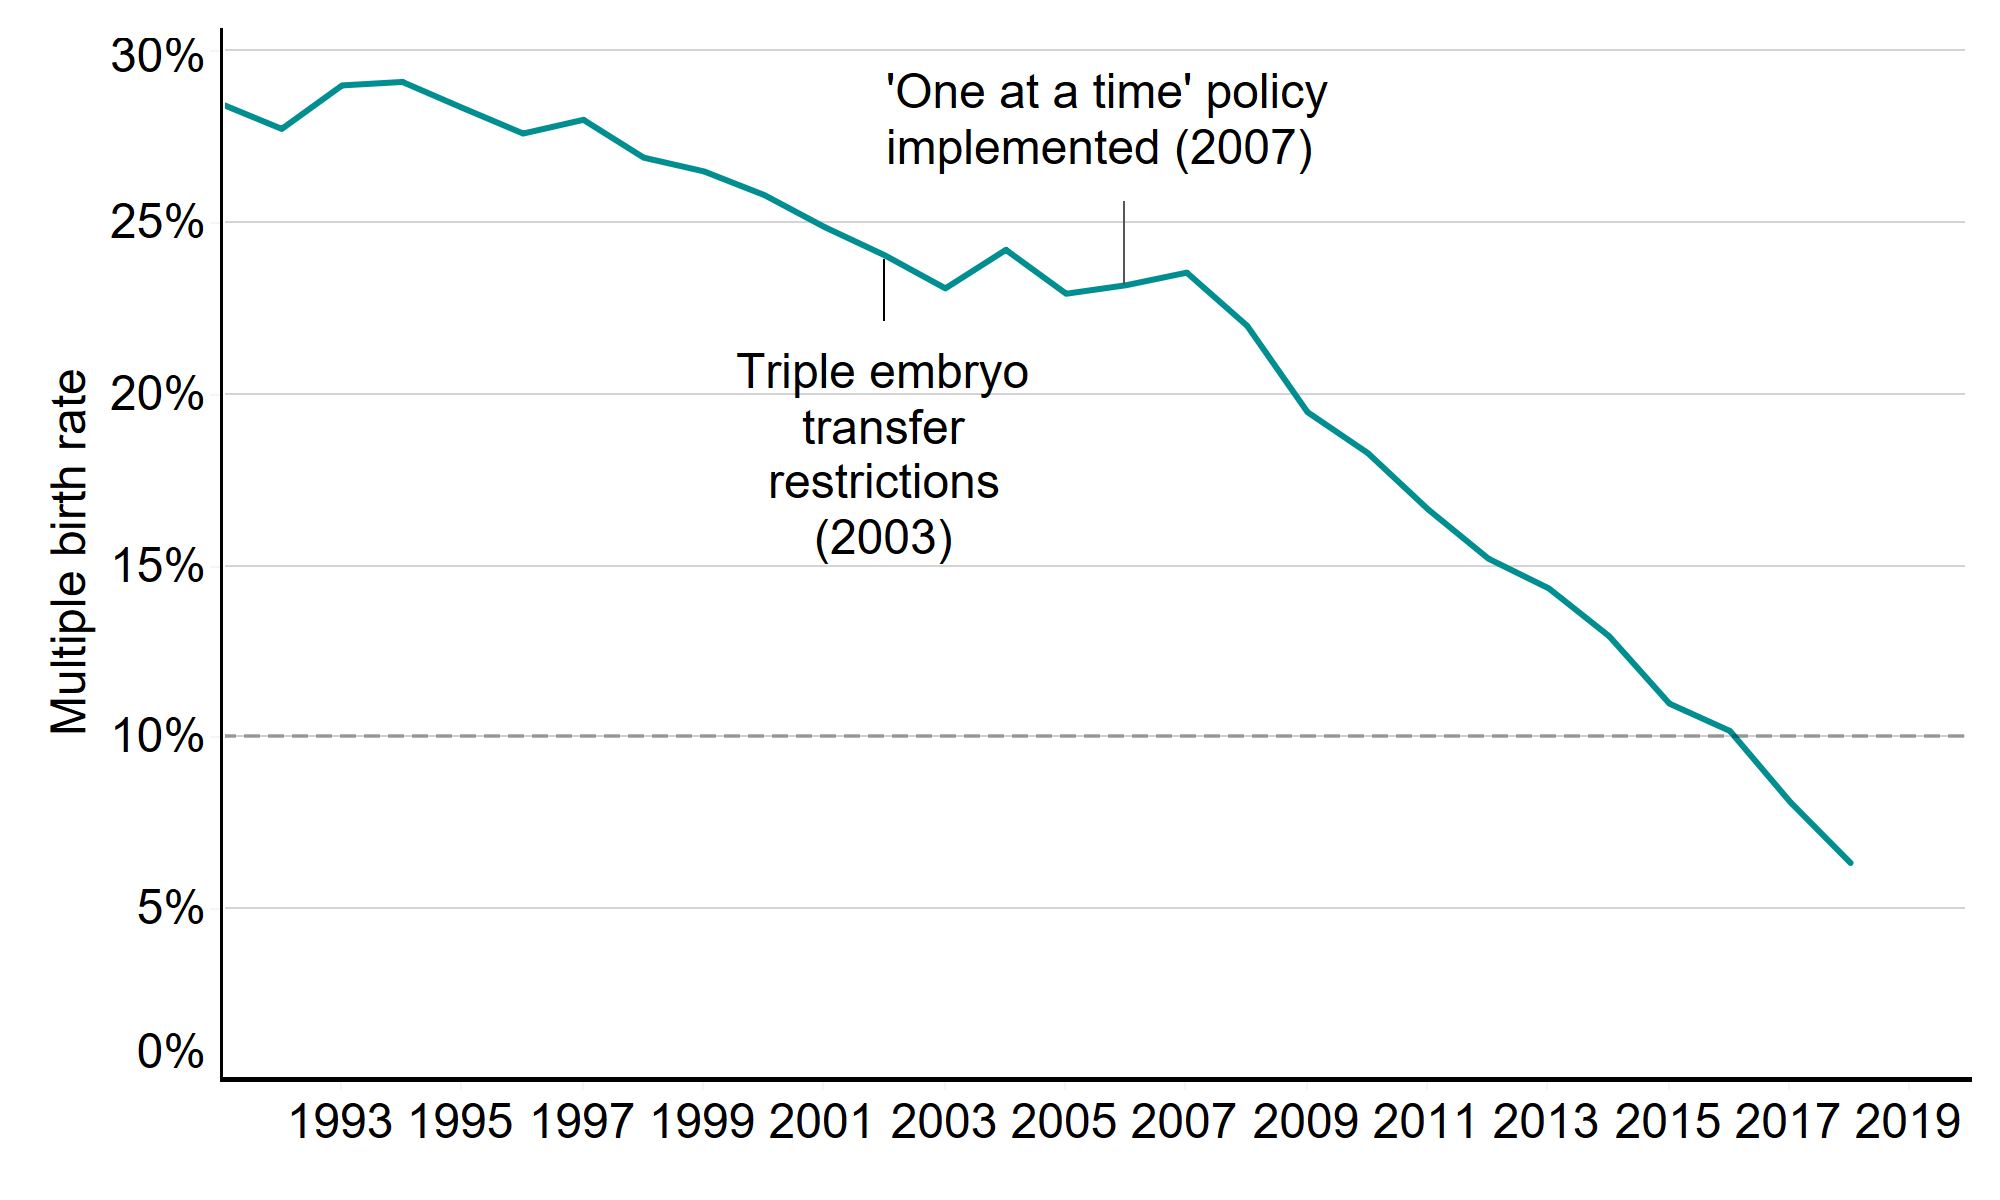
Download the underlying data for Figure 2. (xlxs 29kb)
Note figure 2: This data includes treatment cycles and IVF only. It excludes cycles where pregnancy was recorded but not outcome.
3. Single embryo transfer is now common practice
The risk of a multiple birth is in large part determined by the number of embryos transferred back during IVF treatment. Single embryo transfer has become common practice, and in 2019 one embryo was put back in 75% of IVF cycles, compared to just 13% in 1991.
In the 1990s, three embryos were put back in more than half of IVF cycles. In 2003, triple embryo transfer restrictions were introduced, banning the use of triple embryos in younger women - figure 3 shows the impact of this. It also shows the impact of the ‘One at a time’ campaign, cited above, which encouraged clinics to transfer back one embryo and freeze any remaining embryos for good prognosis IVF patients. The combination of these policies and concerted efforts across the fertility sector led to fewer double and triple embryo transfers, and fewer multiple births as a result.
Figure 3. Great progress has been made in reducing multiple embryo transfers
Single, double and triple embryo transfers as proportion of all IVF cycles, 1991-2019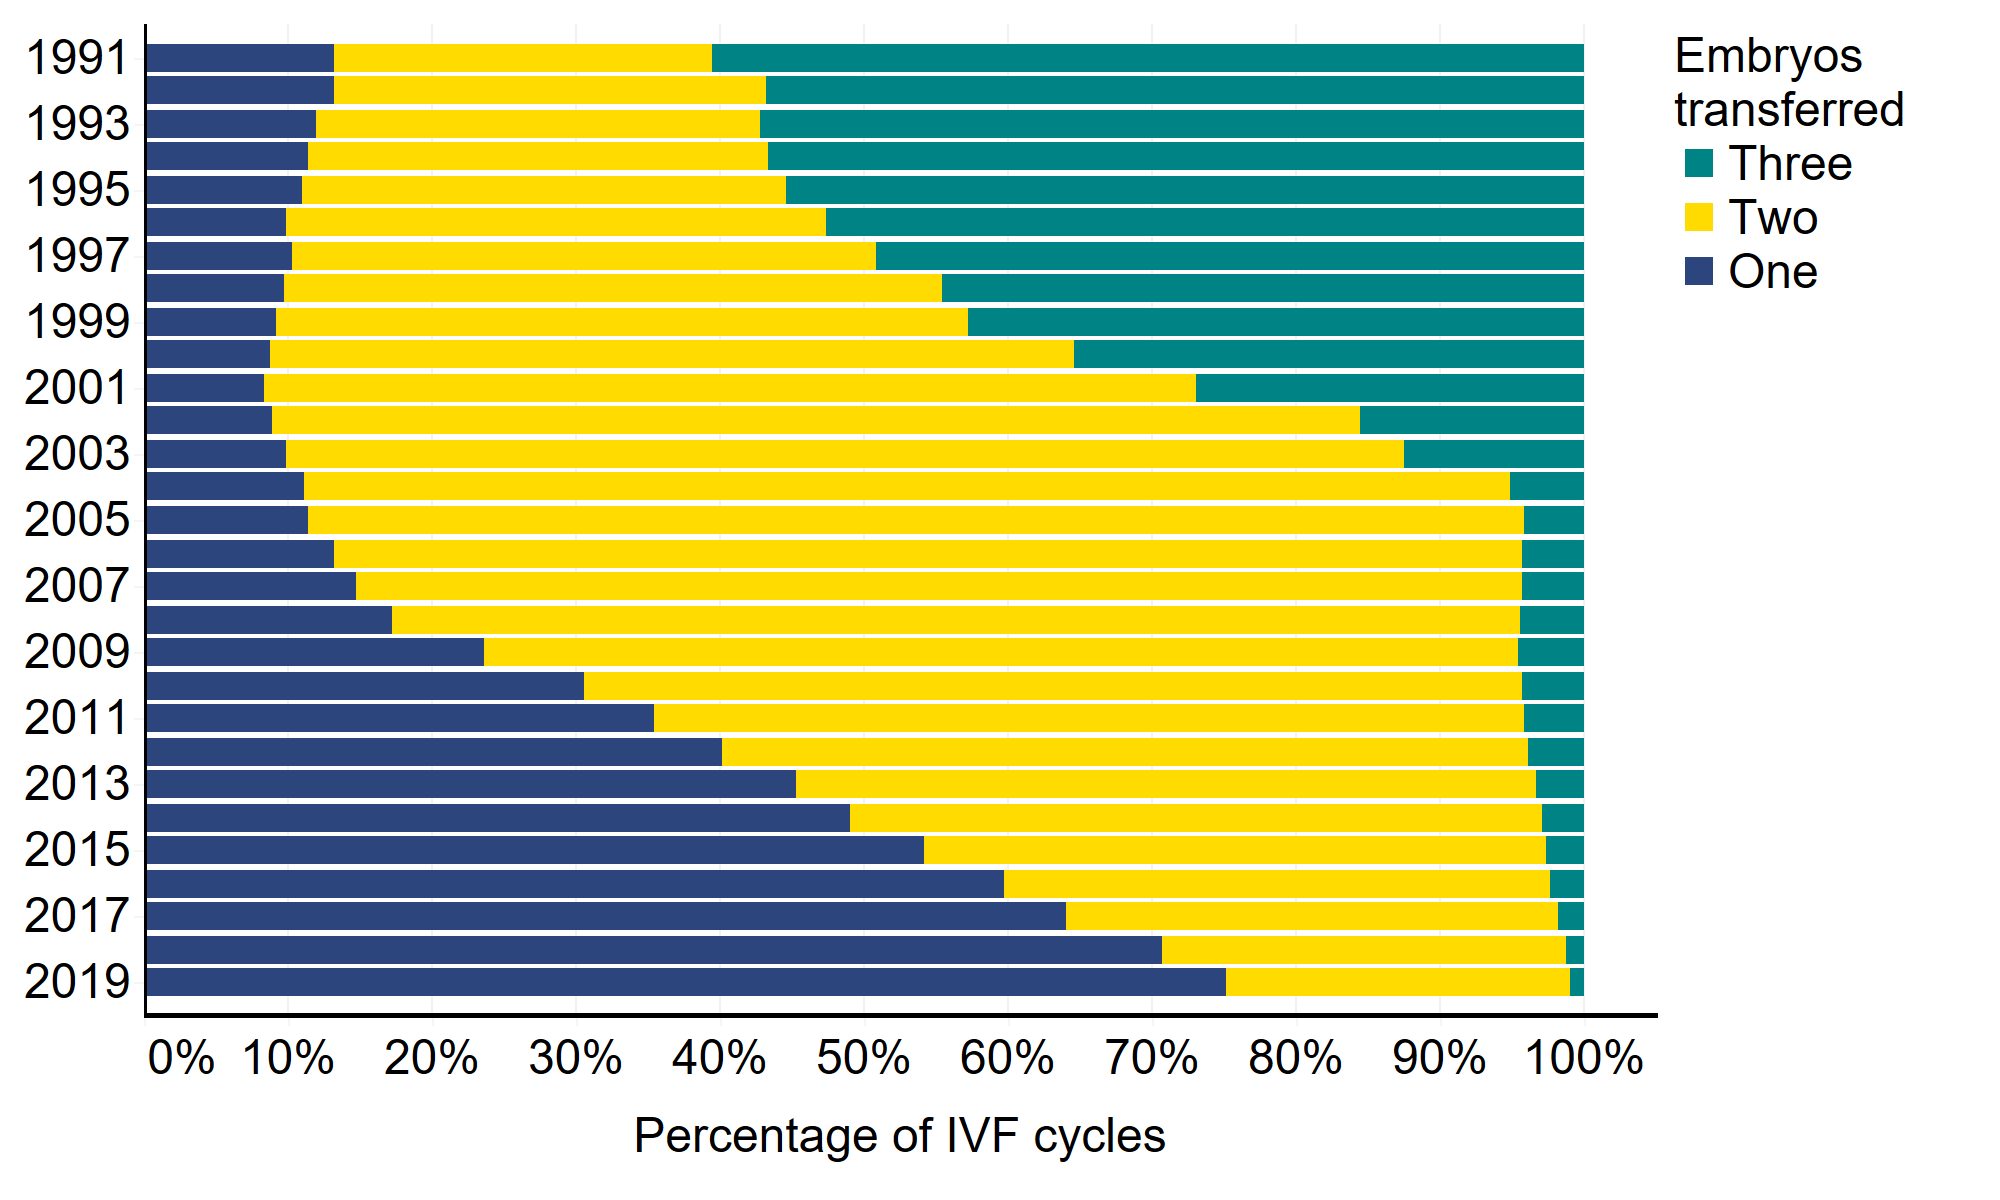
Download the underlying data for Figure 3. (xlxs 29kb)
Note figure 3: This data includes treatment cycles only, IVF and cycles where one to three embryos were transferred.
4. Frozen embryo transfers have increased in use
As freezing techniques and live birth rates have improved, a typical patient today will have a single fresh embryo transferred in their first cycle, and any additional embryos of suitable quality can be stored for use in subsequent cycles. As a result, frozen embryo transfers increased by 86% from 2014-2019, while fresh embryo transfers decreased by 15% in the same period. In 1991, frozen embryo transfers made up just 10% of all IVF cycles, compared to 41% in 2019.
Improvements in egg freezing technology have also made it possible for more patients to freeze their eggs. The use of egg freezing has increased tenfold in the past ten years, from just under 230 cycles in 2009 to almost 2,400 cycles in 2019. This presents an opportunity for patients to preserve fertility for medical reasons, for transgender patients or for women who want to freeze their eggs to have a family later in life, and it is likely that demand for egg freezing will continue to increase in the future.
Figure 4. IVF cycles are levelling off, while frozen embryo transfer increases
Number of IVF cycles over time by fresh and frozen embryos, 1991-2019![Number of IVF cycles over time by fresh and frozen embryos, 1991-2019 [2. Construction] This stacked bar chart showed the number of fresh and frozen IVF cycles each year from 1991 to 2019. [3. Summary] The total number of IVF cycles has increased from 6,651 cycles in 1991 to 68,675 in 2019. The use of fresh embryo cycles has decreased since the peak in 2011 with 47,905 fresh embryo cycles in 2011 and 40,358 in 2019. The use of frozen embryo cycles has continued to increase from 696 in 1991 to 28,317 cycles in 2019. An accessible form of the underlying data for this figure can be downloaded beneath the image in .xls format.](/media/3380/fig-4_fresh-frozen.png)
Download the underlying data for Figure 4. (xlxs 29kb)
Note figure 4: This data includes IVF and treatment cycles. Partial year data for 1991.
5. The use of donor eggs and sperm has increased
Most IVF treatments involve the use of patient eggs and partner sperm (86% of IVF cycles in 2019), but this has changed over time. The use of donor sperm with patient eggs declined in the mid-1990s but increased sharply from the mid-2000s, rising from 1,171 in 2006 to 5,368 in 2019. The mid 1990s decline was largely due to the roll-out of ICSI, which reduced the need for donor sperm usage. However, the increase in the last 15 years is likely due to an increase in same sex or single women using donor sperm.
Though still uncommon, cycles using donor eggs with donor sperm increased 50-fold from 27 cycles in 1991 to 1,375 cycles in 2019. Similarly, only 134 IVF cycles used donor eggs with partner sperm in 1991, this increased 22-fold to 3,058 cycles in 2019.
Figure 5. Use of donor eggs and sperm have increased over the past 30 years
Number of IVF cycles by egg and sperm source, 1991-2019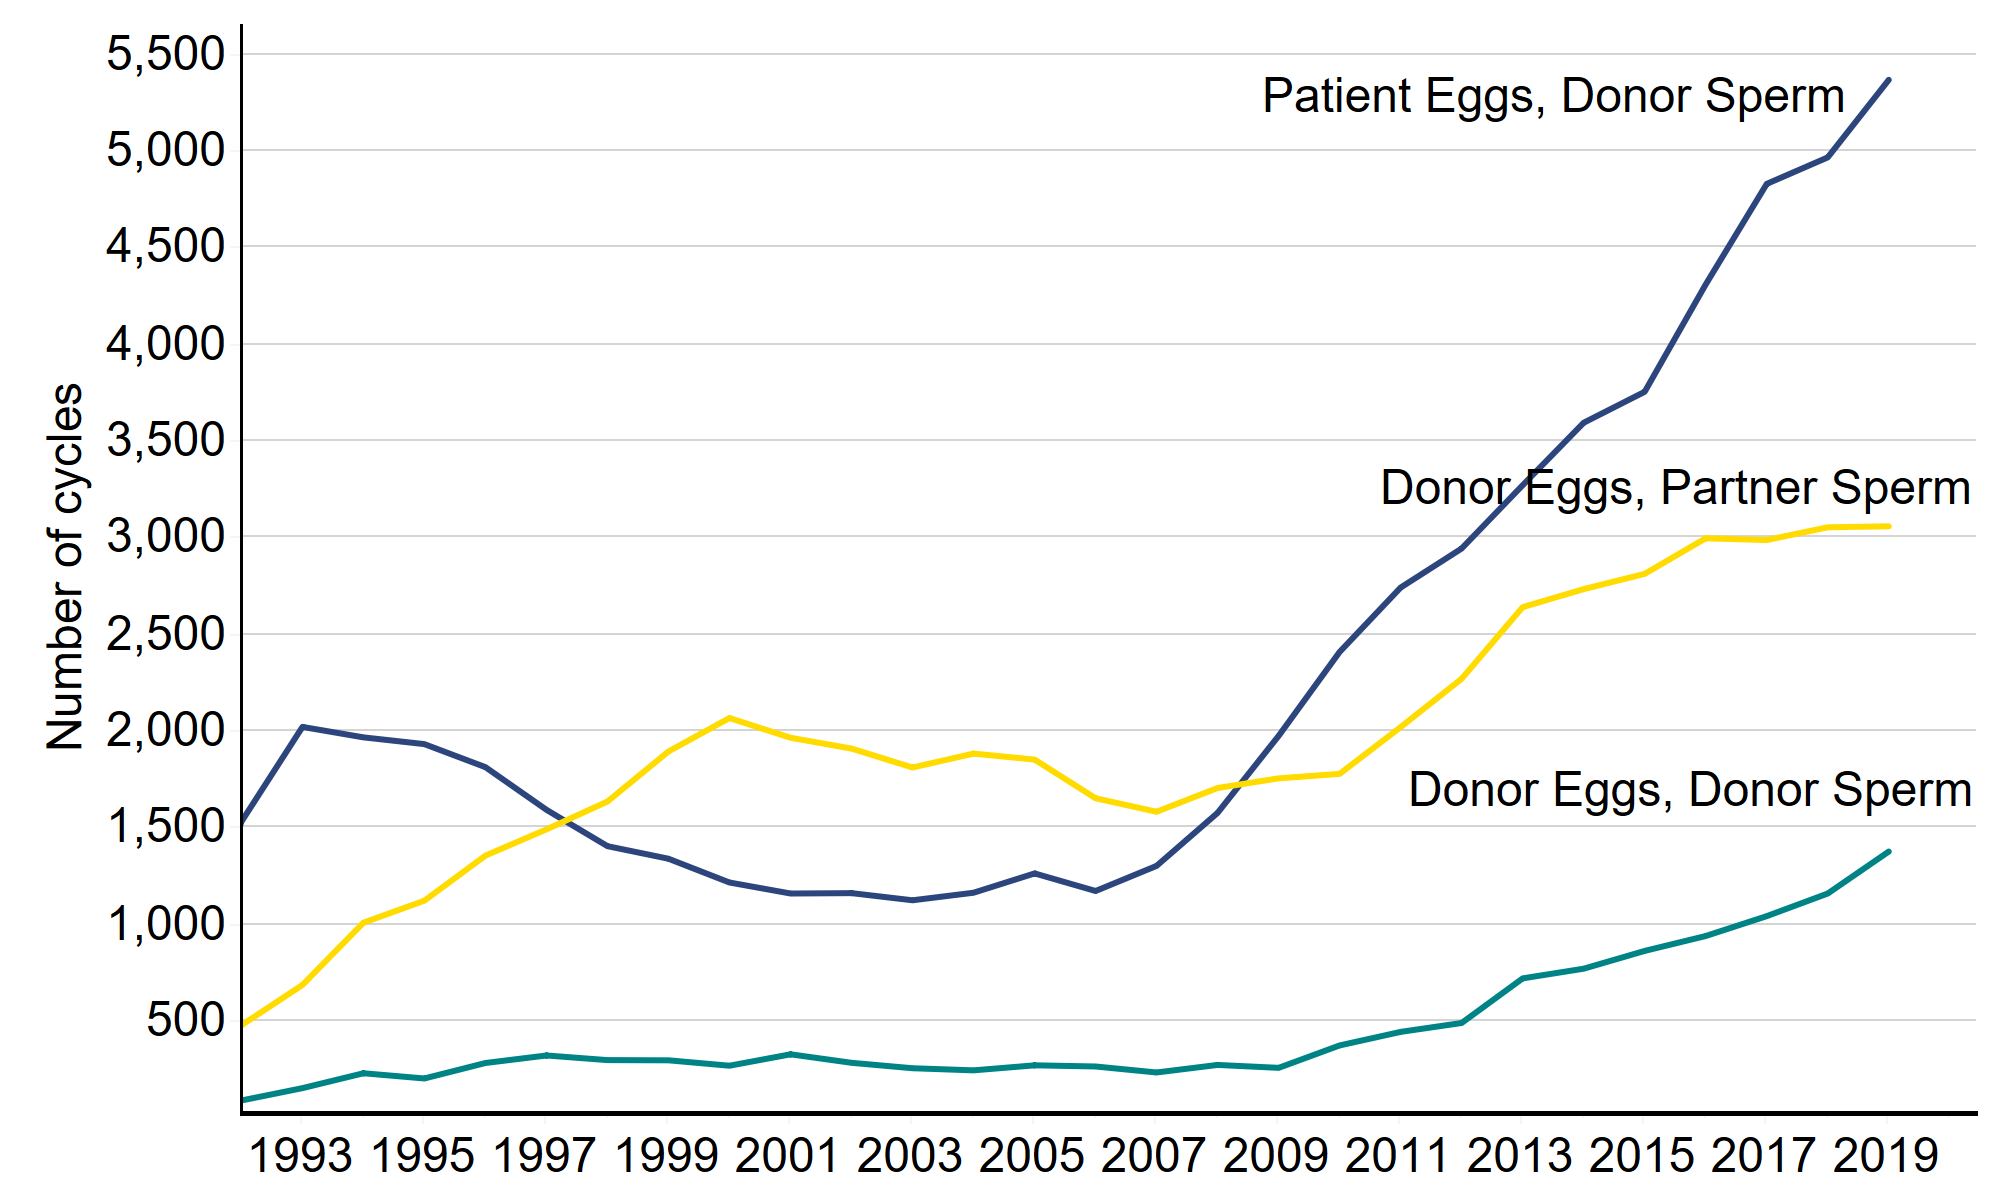
Download the underlying data for Figure 5. (xlxs 29kb)
Note figure 5: This data includes treatment cycles and IVF only. It excludes cycles where sperm source was not recorded. Partial year data for 1991.
As birth rates decline steadily with age when patients use their own eggs, patients in some age groups can increase their chances of success by using donor eggs. In 2019, the birth rate per embryo transferred for patients under 35 using their own eggs was 32%, compared to below 5% for patients 43 and above (Figure 6). However, birth rates remained higher (above 30%) for all ages when donor eggs were used.
Although donor eggs can considerably increase the chance of a live birth for patients over 40, it can be a difficult decision for patients to take and only 17% of patients 40+ use donor eggs. The use of donor eggs increased with age in 2019: 8% for patients aged 40-42, 21% for patients aged 43-44 and 57% for patients aged 45-50.
Figure 6. IVF birth rates are above 30% for patients of all ages where donor eggs are used
Birth rates per embryo transferred by age band and egg source, 2019![This bar chart shows the birth rate per embryo transferred for banded age groups; under 35, 35-37, 38-39, 40-42, 43-44 and 45-50, using both patient and donor eggs. [3. Summary] For patient eggs, the birth rate per embryo transferred decreased as the patient age increased. For patients under 35 years of age using own eggs in treatment, the birth rate per embryo transferred was 32%, in contrast patients 40-45 years of age had birth rates of 4% using own eggs. For patients using donor eggs, the birth rate per embryo transferred was similar across the age groups. For patients under 35 the birth rate per embryo transferred was 34% and for patients in the 45-50 age group it was 31%. An accessible form of the underlying data for this figure can be downloaded beneath the image in .xls format.](/media/3378/fig-6_egg-source.png)
Download the underlying data for Figure 6. (xlxs 29kb)
Note figure 6: This data includes treatment cycles only and IVF. It excludes fresh and frozen PGT-M and PGT-A, surrogacy, and cycles where pregnancy was recorded but not outcome. Birth rates for 2019 are provisional and yet to undergo validation.
6. Fertility treatment has enabled more people to have families later
Since 1999, the average age at which women have children has increased by 2.3 years to 30.7 in 2019, according to the ONS. During the same period, there has been a slower increase in the average age of IVF (+1.3 years) and DI (+1.2 years) patients. However, patients undergoing fertility treatment have remained consistently older than women having children without the help of fertility treatment. In 2019, the average age of women undergoing IVF (35.7) or DI (34.5), was notably older than the average age (30.7) of women having children nationally.
More strikingly, there has also been a gradual shift in the number of older patients embarking on fertility treatment. In 1991, the majority (58%) of IVF cycles involved patients aged under 35 and this had fallen to 40% in 2019 (Figure 6). At the same time, the proportion of IVF cycles undertaken by patients aged 40 and over has increased from 10% (689 cycles) in 1991 to 21% (14,761 cycles) in 2019.
Figure 7. A growing proportion of IVF patients are aged 40 and above
Proportion of IVF cycles by patient age group, 1991-2019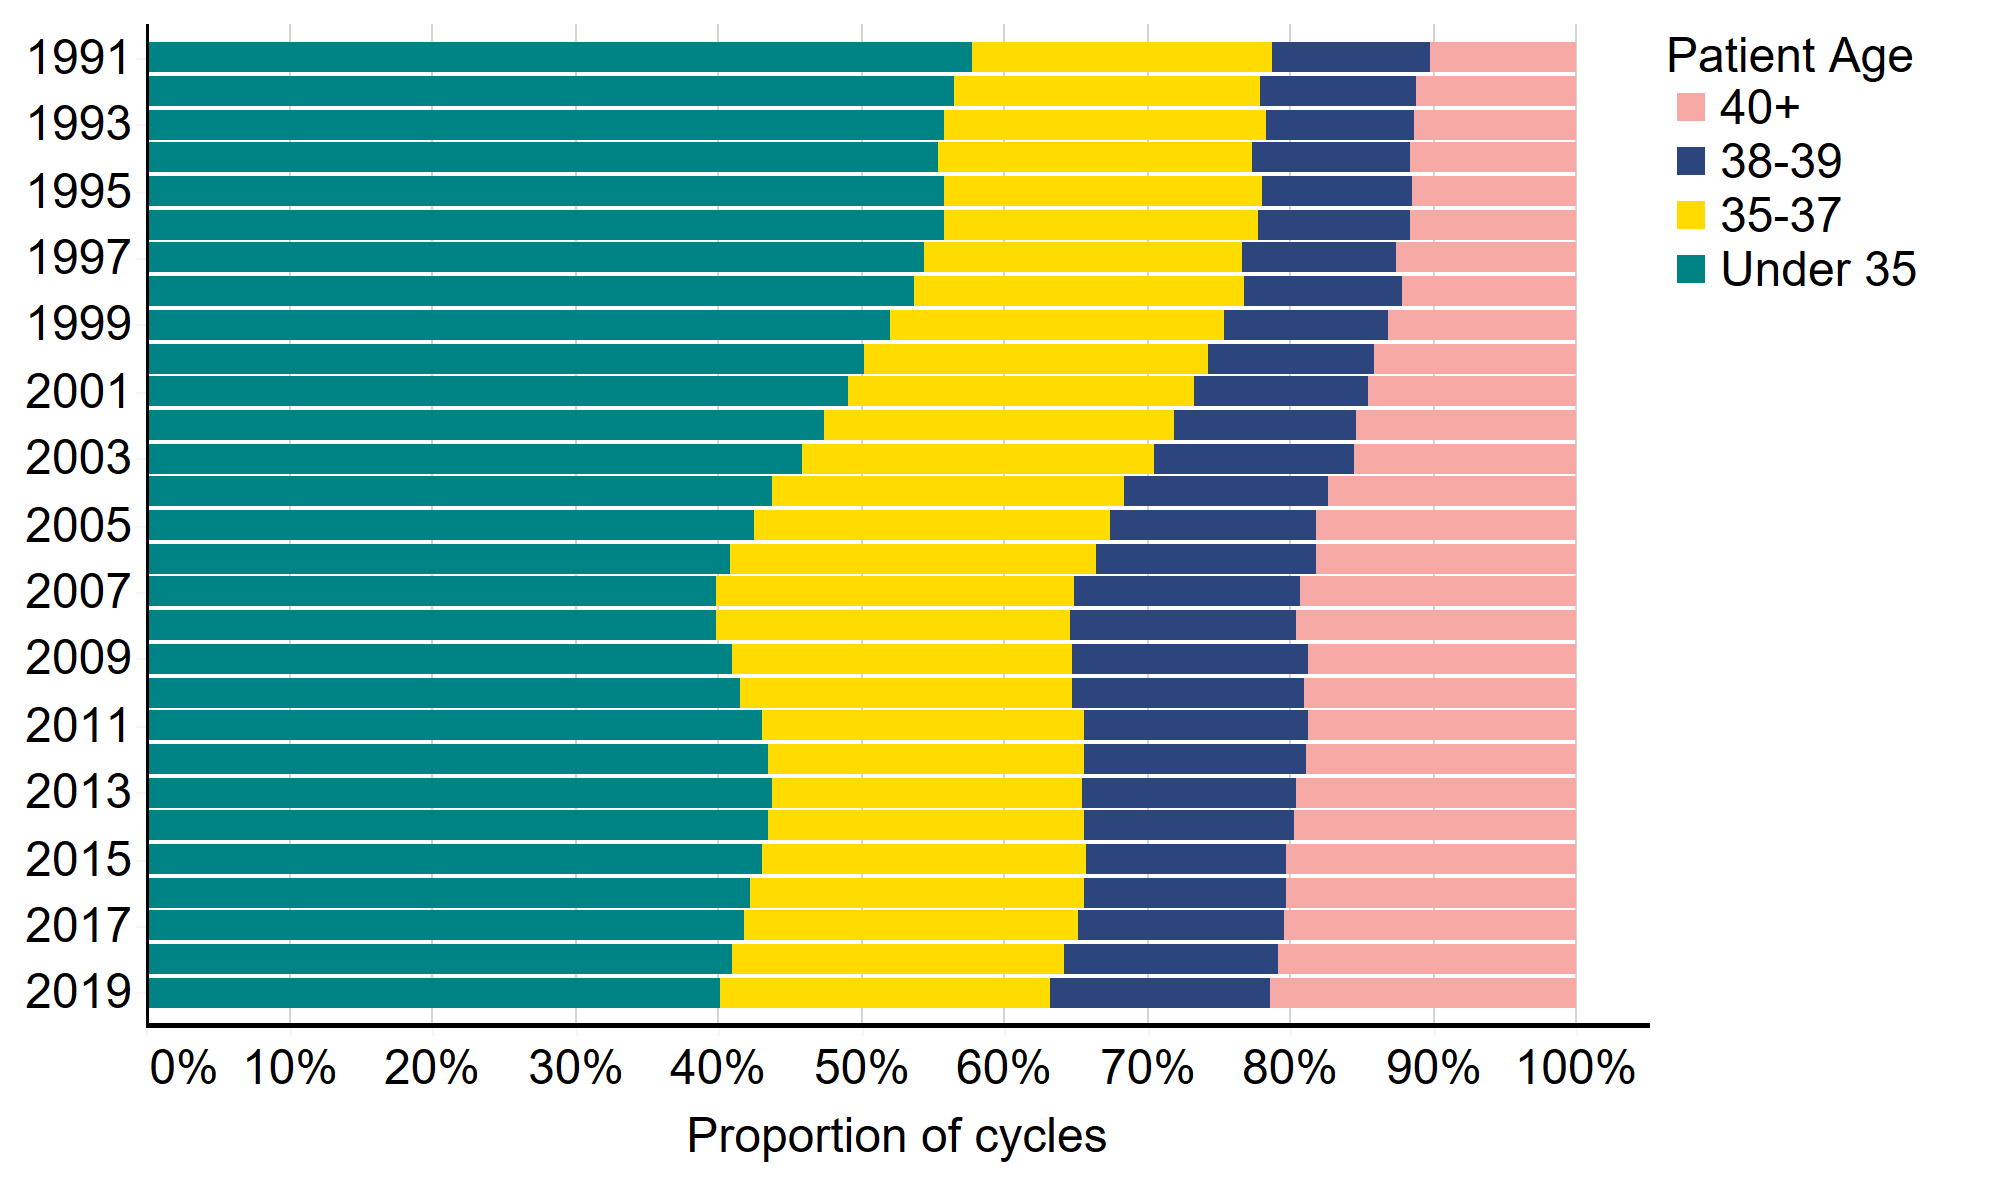
Download the underlying data for Figure 7. (xlxs 29kb)
Note figure 7: This data includes treatment cycles and IVF only.
7. Fertility treatment enables more patients with different partner types to have genetically linked families
Not only has fertility treatment provided many more families with the opportunity to become parents at older ages, it has also provided the same opportunity for same-sex couples and those with no partner. As highlighted in our recent family formations report, family structures are changing and the fertility sector is playing a part in those changes.
Although treatment with a male partner still dominates in IVF treatment (94% in 2019), there are an increasing number of cycles involving patients in female same-sex relationships or with no partner. In 2019, 2,435 IVF cycles (4% of all cycles) involved a female partner, a four-fold increase compared to 489 cycles in 2009 (1%). In 2019, 1,470 cycles (2%) involved no partner, compared to 565 in 2009 (1%).
The total number of DI cycles among patients with a male partner has fallen from 2,211 in 2009 to 2,153 in 2019. In 2019, patients with a female partner accounted for the largest proportion (44%) of DI treatments, followed by patients with a male partner (38%) and those with no partner (18%).
Table 1. DI is most commonly used by patients with a female partner
| Male partner | Female partner | No Partner | |||||
|---|---|---|---|---|---|---|---|
| Cycles | % | Cycles | % | Cycles | % | ||
| IVF | 2019 | 64,774 | 94% | 2,435 | 4% | 1,470 | 2% |
| 2009 | 53,396 | 98% | 489 | 1% | 565 | 1% | |
| DI | 2019 | 2,153 | 38% | 2,514 | 44% | 1,027 | 18% |
| 2009 | 2,211 | 57% | 984 | 25% | 702 | 18% | |
Note table 1: This data includes treatment cycles and excludes surrogacy. Reliable data not available prior to 2009.
Download the underlying data for Table 1. (xlxs 29kb)
8. There is considerable variation in NHS funding across the UK
NHS funding for IVF cycles varies considerably across the UK. In 2019, there was significantly more NHS-funded treatment of IVF cycles (62%) in Scotland compared to other UK nations: Wales 39%, Northern Ireland 34% and England 32% of IVF cycles.
The number of NHS-funded cycles in Scotland has risen over the past five years, from 58% in 2014 to 62% in 2019. However, NHS funding has declined in all other nations from 2014-2019. Funded cycles in England have fallen from 40% in 2014 to 32% of cycles in 2019. In Wales, they fell from 42% to 39% over the same period. In Northern Ireland, 50% of cycles were funded in 2014. In 2019 the rate was 34%.
In Scotland, Wales and Northern Ireland, the level of funding is set nationally. In England, funding is locally determined by Clinical Commissioning Groups (CCGs) leading to considerable regional variation in funding. Many CCGs have reduced funding for fertility treatment and as a result, the share of IVF cycles funded by the NHS has declined across most English regions. In the last five years, three English regions have seen double digit declines. In the East of England, 20% of cycles were funded in 2019 (down from 54% in 2014). In Yorkshire and the Humber and the South East of England, 25% and 31% of cycles were funded in 2019 compared to 41% and 44% respectively in 2014.
Figure 8. There is a post code lottery when it comes to IVF funding, and funding has declined across England and Northern Ireland
NHS funding of IVF cycles in UK nations and English regions, 2019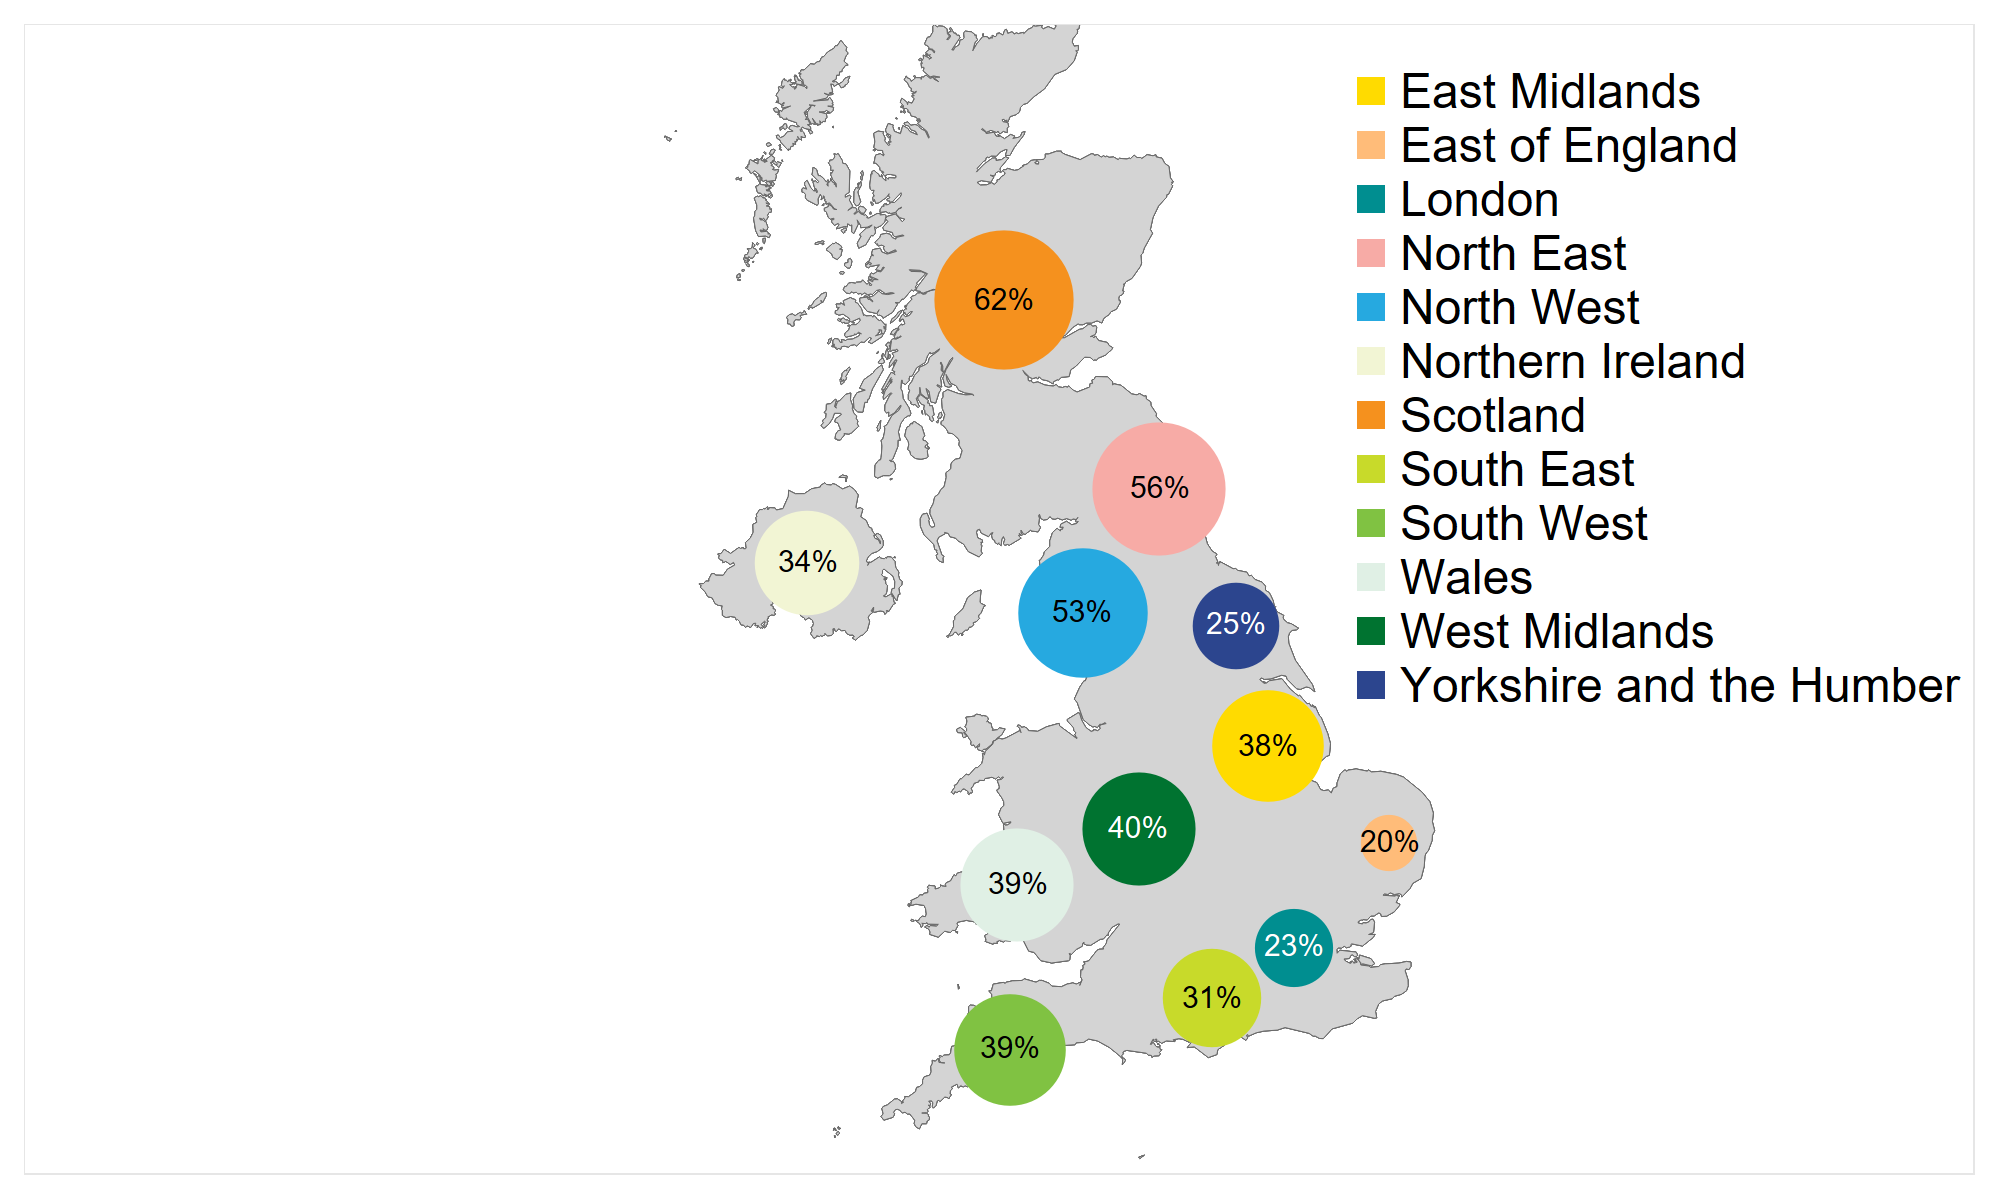
Download the underlying data for Figure 8. (xlxs 29kb)
Note figure 8: This data includes treatment now and IVF only. The bubble sizes are in ratio to the proportion of NHS funded cycles.
Looking at funding by age over time, it is younger age groups, who are more likely to achieve a successful pregnancy from treatment, who were most affected by funding cuts in recent years. In 2019, around half (48%) of cycles among under 35s were NHS-funded, down from 54% just two years previous. Similarly, 35% of cycles among those aged 35-37 were NHS-funded, compared to 40% in 2017. There has been little or no change in the last two years for those aged 40+, where funding eligibility is already low.
Figure 9. NHS-funded cycles have declined among the younger age groups in particular
Percentage of NHS-funded IVF cycles by patient age, UK, 2009-2019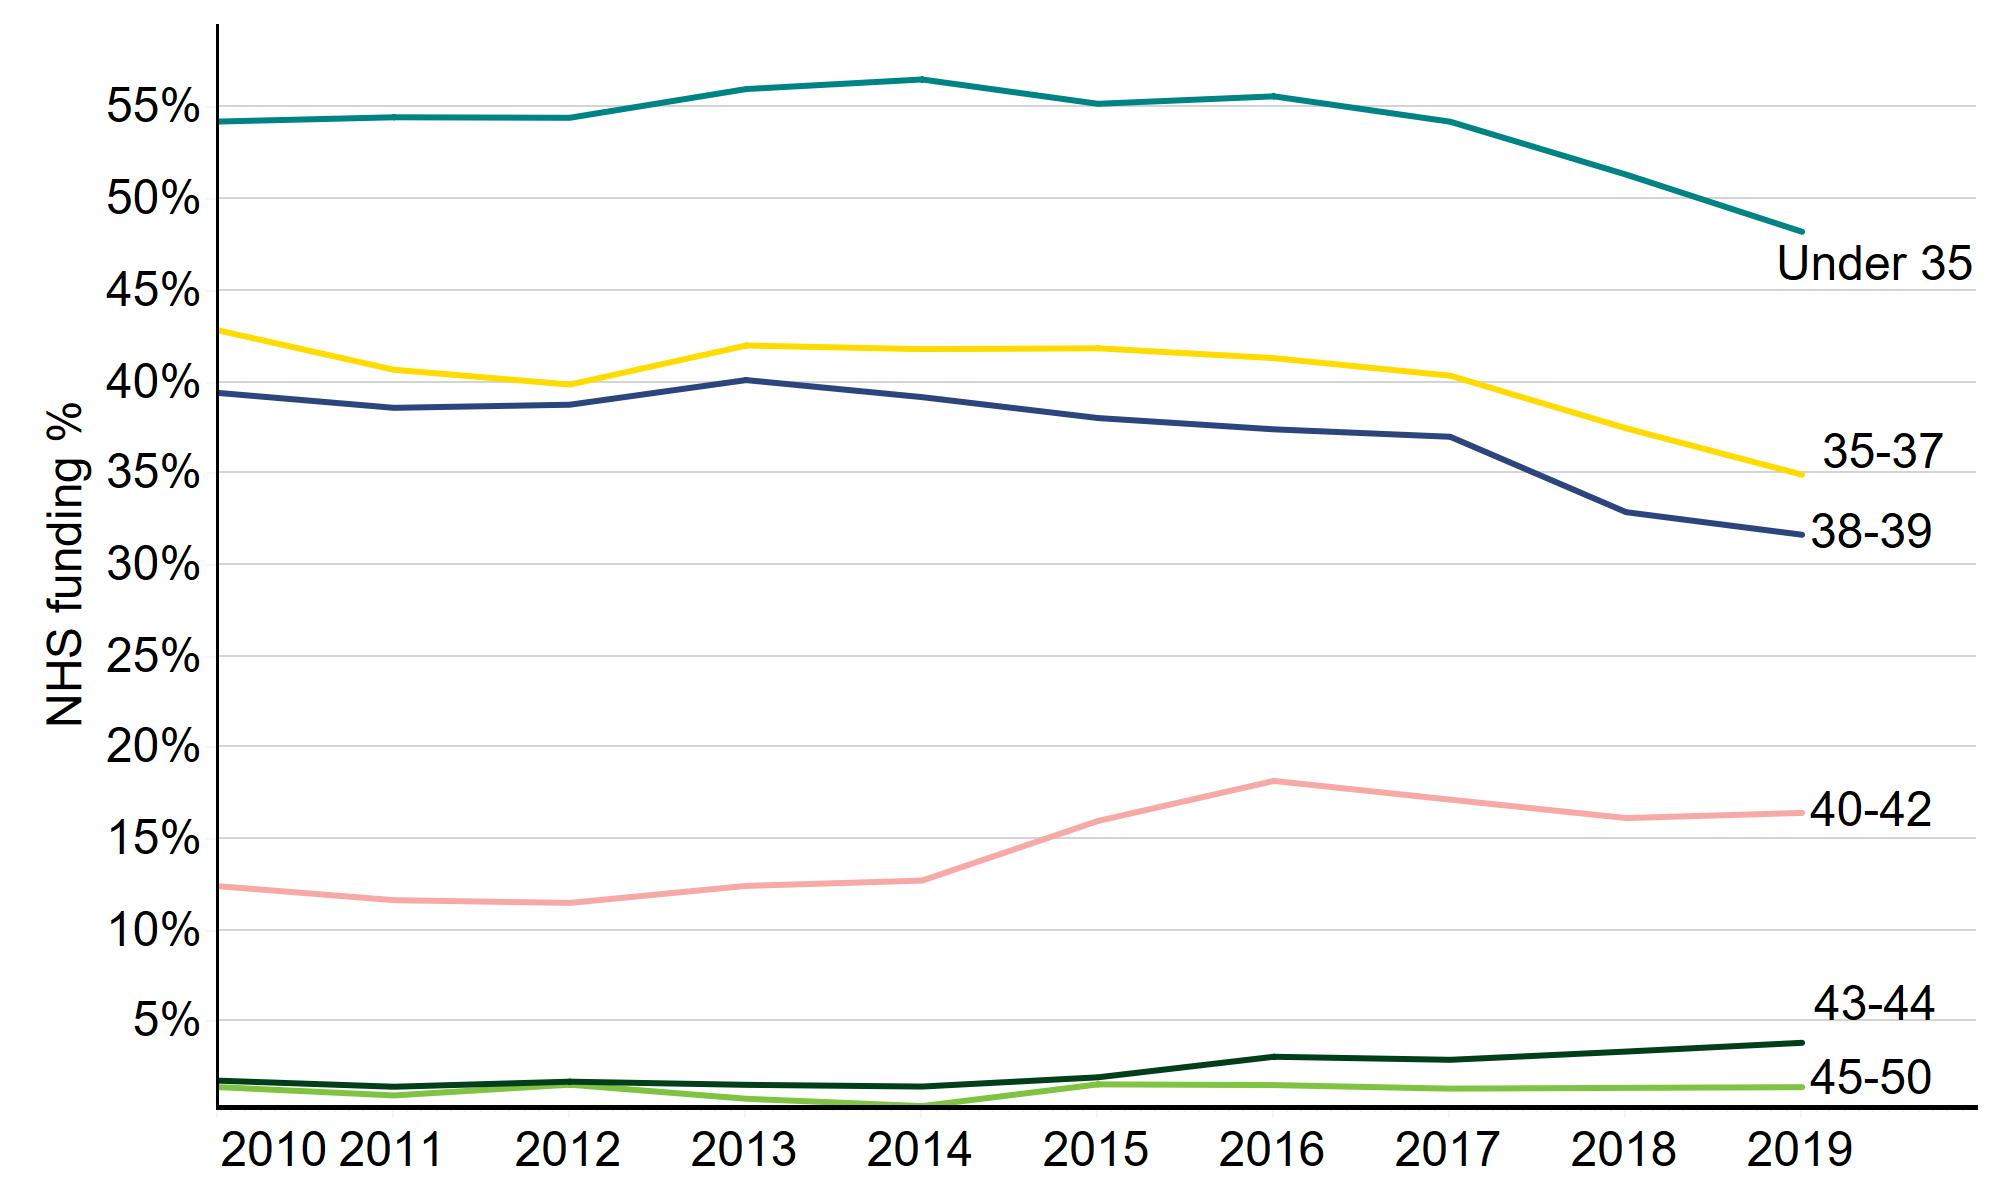
Download the underlying data for Figure 9. (xlxs 12kb)
Note figure 9: This data includes treatment cycles and IVF only. Where no age is indicated cycles have been excluded. Data not reliably available prior to 2009.
About our data
These are official statistics. This report covers the period from 1991-2019 where data is available. Data for 1991 covers a partial year, starting in August 1991. The information that we publish is a snapshot of data provided to us by licensed clinics. The figures supplied in this report are from our data warehouse containing Register data as at 12/12/2020. We have excluded approximately 1,540 cycles due to technical issues at one centre that resulted in reporting errors. Results are published according to the year in which the cycle was started. For further information, please see our quality and methodology report. Unless stated otherwise, the data in this report refers to treatment cycles i.e. only those cycles where the patient recorded on their registration form that they intended to become pregnant. All data used in this report is pre-COVID 19.
Contact us regarding this publication
Media: press.office@hfea.gov.uk
Statistical: intelligenceteam@hfea.gov.uk
Accessibility: comms@hfea.gov.uk
Regulating for 30 years
You have chosen not to allow videos from the 3rd party streaming service (YouTube), if you would like to see these videos, please change your Privacy policy and cookie settings.
| Publication date: |
|---|